Results 1 to 17 of 17
  1. Default chart: how much extra att you need to be equal to 1 extra %stat


    made for a basil question, hope my math checks out

    Spoiler


    in retrospect it would have been better to do it the other way around instead of inverting the whole thing at the end
    ideally you want your number to be the same as the cost of 1 extra %stat divided by the cost of 1 extra att

  2. Default Re: chart: how much extra att you need to be equal to 1 extra %stat


    Your formula should be correct, but can be simplified to a * s / 25 / [4*s*(1+p/100)+d].

  3. Default Re: chart: how much extra att you need to be equal to 1 extra %stat


    If it's not too much to ask for, could you upload the excel for us?

  4. Default Re: chart: how much extra att you need to be equal to 1 extra %stat


    no big secrets here, the cell formula's even on the image
    here you go anyway (xlsx): http://www.mediafire.com/?e4ci8rm9fken2ix

  5. Default Re: chart: how much extra att you need to be equal to 1 extra %stat


    If InnerAbilityAtk = CharChardAtk = 0 cannot be assumed, the solution will be
    TotalAtk * 4 * Main / (100+AtkPct) / (4*TotalMain + TotalSub)
    = [Atk + (InnerAbilityAtk + CharCardAtk) / (100+AtkPct)] * 4 * Main / (4*TotalMain + TotalSub)

    Bolded term is what changes, and Atk is +attack from gear & skills only.

    "All Solutions

  6. Default Re: chart: how much extra att you need to be equal to 1 extra %stat


    Only for what ever STR based class you're using or what..?

  7. Default Re: chart: how much extra att you need to be equal to 1 extra %stat


    uh.. sorry, what is this?
    no explanation or anything
    also, is it known that %att doesn't affect card and ia?

    works for all classes, but maybe not for xenon

  8. Default Re: chart: how much extra att you need to be equal to 1 extra %stat


    change in range per change in X = partial derivative of range equation

    Set the partials equal to each other and solve for dX when dY = 1 to obtain the change in X that is equivalent to a 1 unit change in Y.

  9. Default Re: chart: how much extra att you need to be equal to 1 extra %stat


    Close, but no cigar. This would tell you WHEN an increment by one in either stat will result in a similar change in damage range, not how much one of them should change by to match the unit change of the other. Key: Setting the partials (the amount of change of damage per UNIT change in each variable) equal to each other.

    maths don't lie


    I believe what we have to do instead is to integrate both sides of the the partial wrt primaryStat from currentDmg to finalDmg to get the change in damage to correspond to the appropriate change in primaryStat.


  10. Default Re: chart: how much extra att you need to be equal to 1 extra %stat


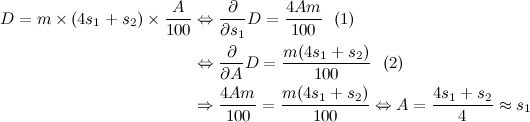
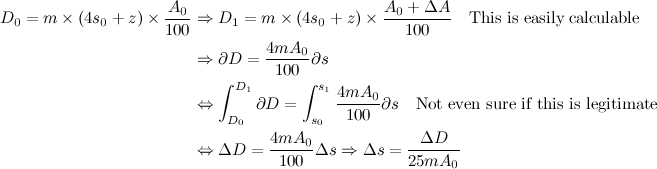
    Instead of trying to obtain a change in primary stat, s1, via derivatives, in this case it is cleaner to set the %stat as a separate variable, then obtain the partial derivatives from there on.

    Or in this case, since there's little point trying to complicate things via partials (although it is legit), a simple (1 + K + deltaK)*s1 will do, where K is the %stat in decimals, assuming you're only doing a single-variable change.

    Maybe someone should just bother to do a spreadsheet that combines all the partial derivatives together to compare two items up for grabs.

    Hadriel
    [Math never lies... unless you lied to yourself =P]

  11. Default Re: chart: how much extra att you need to be equal to 1 extra %stat


    I set them equal to each other is because we are assuming change in range is equal. So I did deltaR = deltaR -> A*deltaX = B*deltaY -> deltaX = B*deltaY/A -> deltaX = B/A when deltaY=1.

    The result from your last pic goes deltaR = A*deltaX -> deltaX = deltaR/A. Substituting deltaR=B*deltaY in gives deltaX=B*deltaY/A -> deltaX=B/A when deltaY = 1, which would give the same result as what I did.

    I just treated dX and deltaX as interchangeable because I was lazy. Thanks for showing that they really are interchangeable with that integral down there.

    Yeah I split S1 into s1*(1+K) in order to get the partial with respect to K in like 1 line. Except the variables were names S1 = TotalMain, s1 = Main, and K = MainPot in my thingy.

    And for a spreadsheet it would be probably be easier to just compute the ranges for 2 different items directly than using partials. Computing it directly takes 1 computation total, computing it with partials takes 1 computation per variable involved. The partials change every time a variable is changed.
    Not a bad way of checking if the maths are correct though.

  12. Default Re: chart: how much extra att you need to be equal to 1 extra %stat


    Oh oops then. Didn't exactly bother to see what's within the code because I'm not sure if I'm meant to look that closely at it either.

    Hadriel

  13. Default Re: chart: how much extra att you need to be equal to 1 extra %stat


    The changes (deltaX and deltaY) being proportional is definitely true; "setting the partials equal to each other" was just a mathematical miswording, I suppose, because it doesn't say what you meant to say.

  14. Default Re: chart: how much extra att you need to be equal to 1 extra %stat


    Yeah I wasn't consistent in my definitions in that post, so it's easy to see why it could be misinterpreted.

    Sorry for the poor wording there lol

  15. Default Re: chart: how much extra att you need to be equal to 1 extra %stat


    calc isn't my forte..
    is what I did in the spreadsheet incorrect/naive?

  16. Default Re: chart: how much extra att you need to be equal to 1 extra %stat


    Our solutions are equivalent to each other.

  17. Default Re: chart: how much extra att you need to be equal to 1 extra %stat


    Let's put it this way. You want to convert from degrees Fahrenheit to degrees Celsius. I can either give you the formula, or give you a conversion table. If you want the quick and dirty, you'll use the table; if you want precision, you'll use the formula. Both have their uses.

    Your method works, but is not mathematically efficient. You're basically doing a contour plot of the function dA/dk = [4pA / (4p*(100+k) + s)], where p = primary stat, A = (magic) attack, and k is %stat, and with k (%stat) and A ((M)ATT) as the axes. In words, you're doing a plot to map out the amount of change of A for every unit change in k. This was derived from a simple division of the derivatives, (dD/dk) / (dD/dA). Just some intermediate calculus [I think...? My education is a tad different from everyone else I think...]. A pity WolframAlpha doesn't accept Mathematica commands anymore, else you can see for yourself what I'm talking about... But because linearity holds, your spreadsheet allows a user to directly multiply values with the multiple of %stat, so that one isn't merely confined to 1%stat, something that plots don't easily tell but tables of numbers do.

    But with upcoming changes, you will eventually find that comparing %stat to (M)ATT will become even less valuable than what little value it holds right now.

    Hadriel

  18.  

Bookmarks

Posting Permissions

  • You may not post new threads
  • You may not post replies
  • You may not post attachments
  • You may not edit your posts
  •